Today’s blog post is once again about the visualization of movie data. As I already experimented with the IMDb dataset to compare the average age of actors and actresses, I wanted to try something a bit different. One thing that I have always found cool is the visualization of movie plots (e.g. xkcd). The reason why I never attempted to do something like this myself was that I had no idea from where I could get the required data. Of course, there is always the possibility to generate the data manually, but that is usually a tedious task that I try to avoid. Fortunately, I found a much more convenient data source, while I was watching a movie on the Amazon Video app.

Its X-Ray feature shows you relevant IMDb information based on which actor is currently in the scene. The app does that based on a single text file which contains the information for when a character appears in a scene. At the end of the post, I will describe how you can extract the file yourself. First, I downloaded the X-Ray file for the latest Star Wars movie. Based on this data we can compare the characters by their screen time.
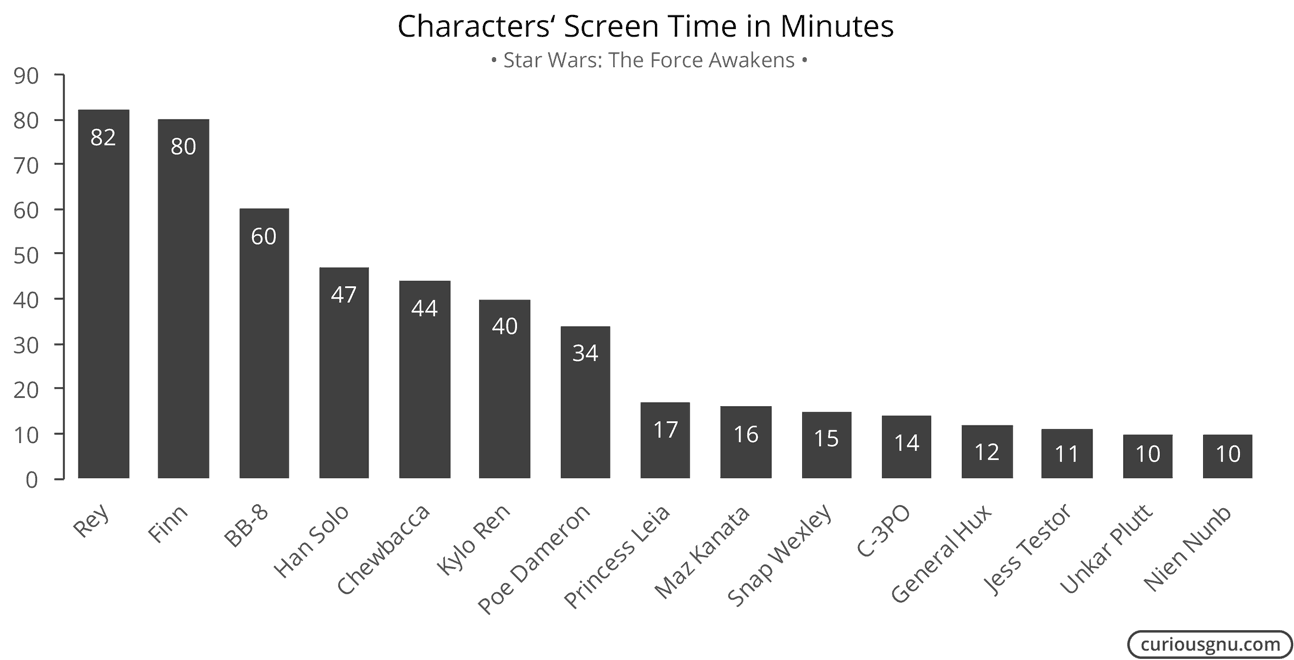
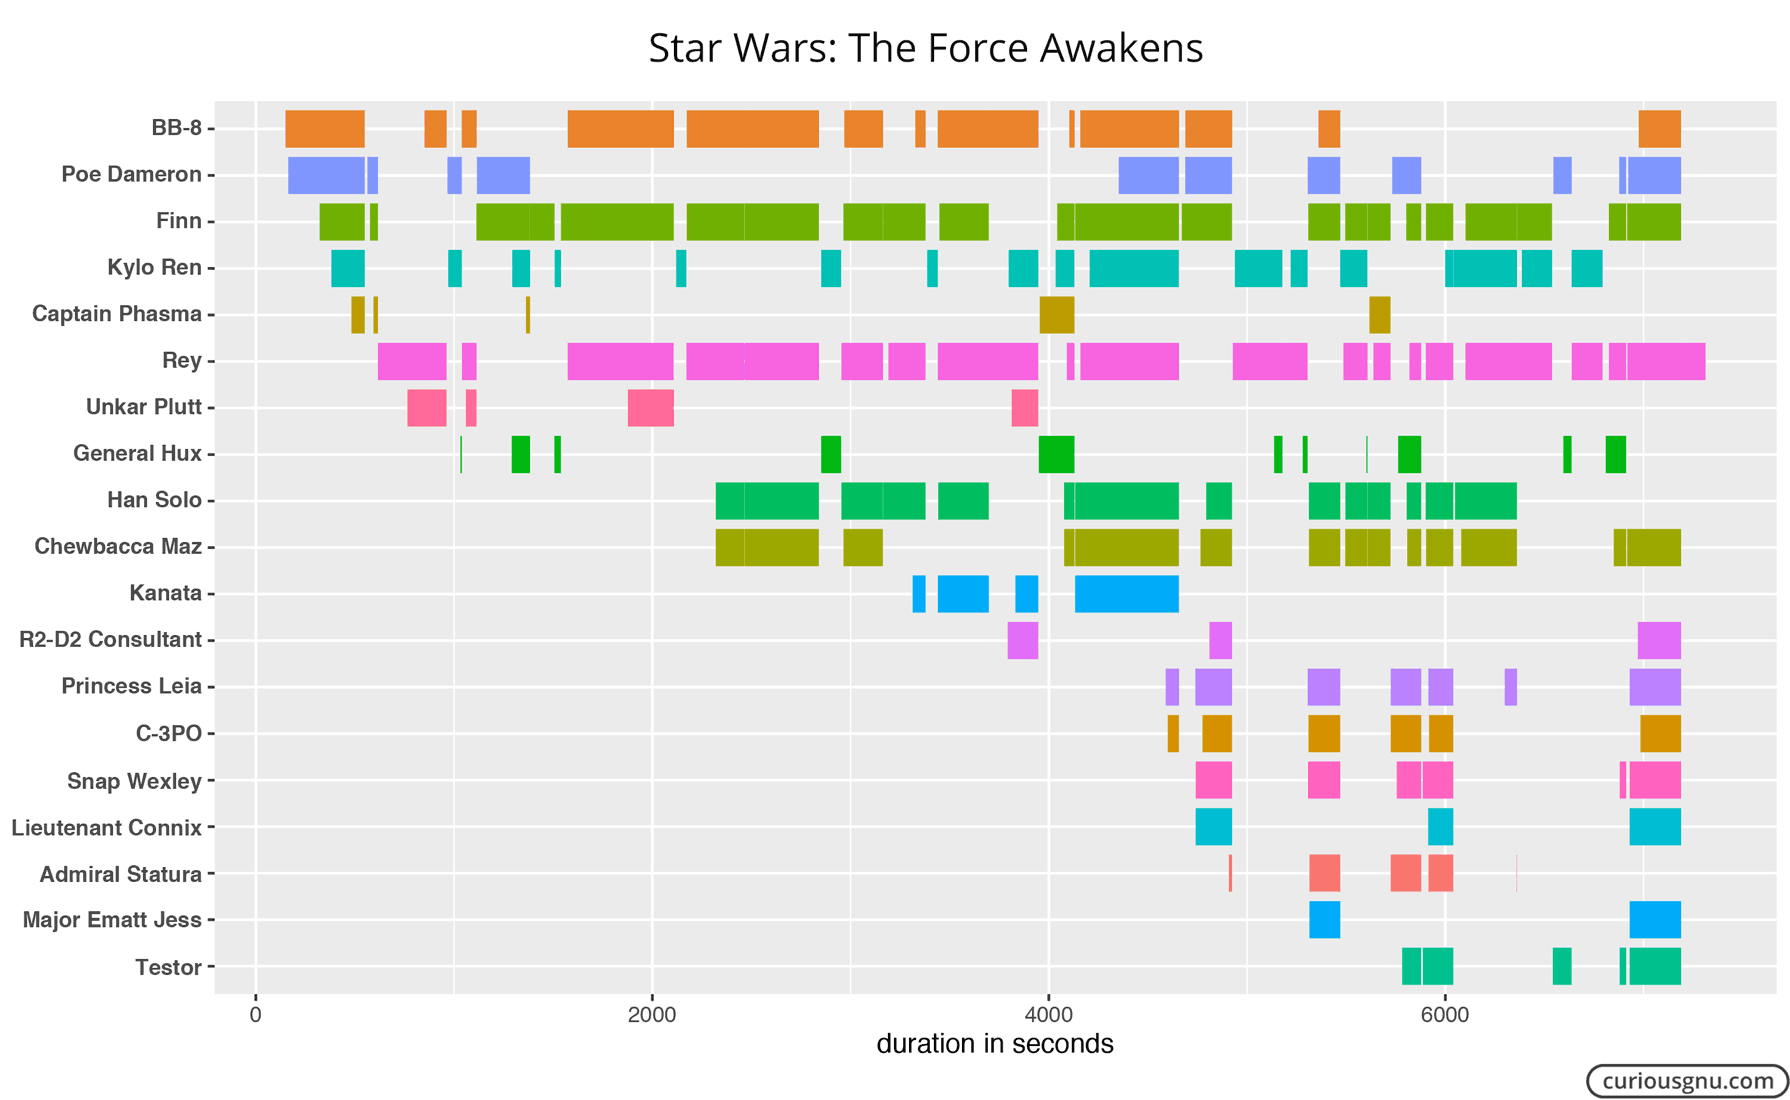
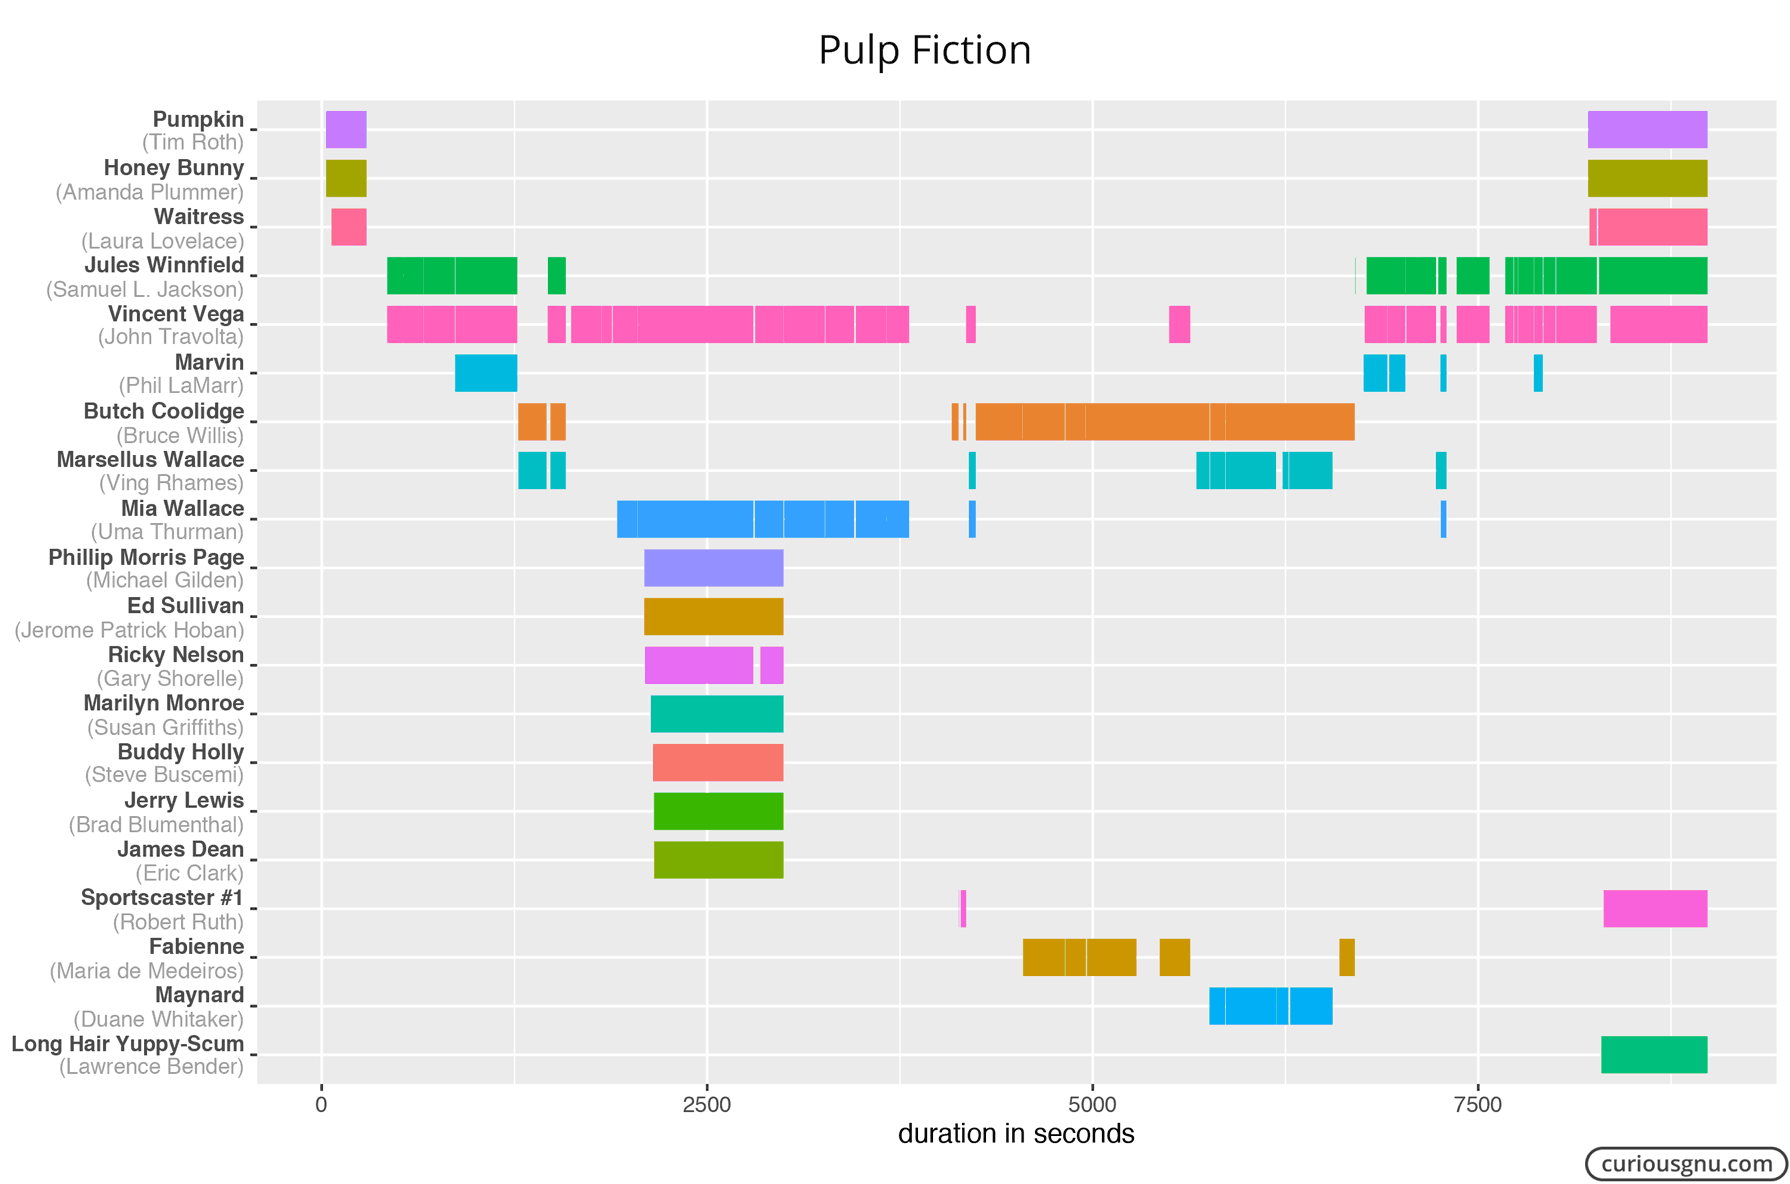
I noticed that the numbers are not always 100% accurate because some characters are only visible in parts of a scene. However, it should not be a major problem for which we are using them in this post. Next, I used the ggplot2 package in R to plot the following Gantt chart:
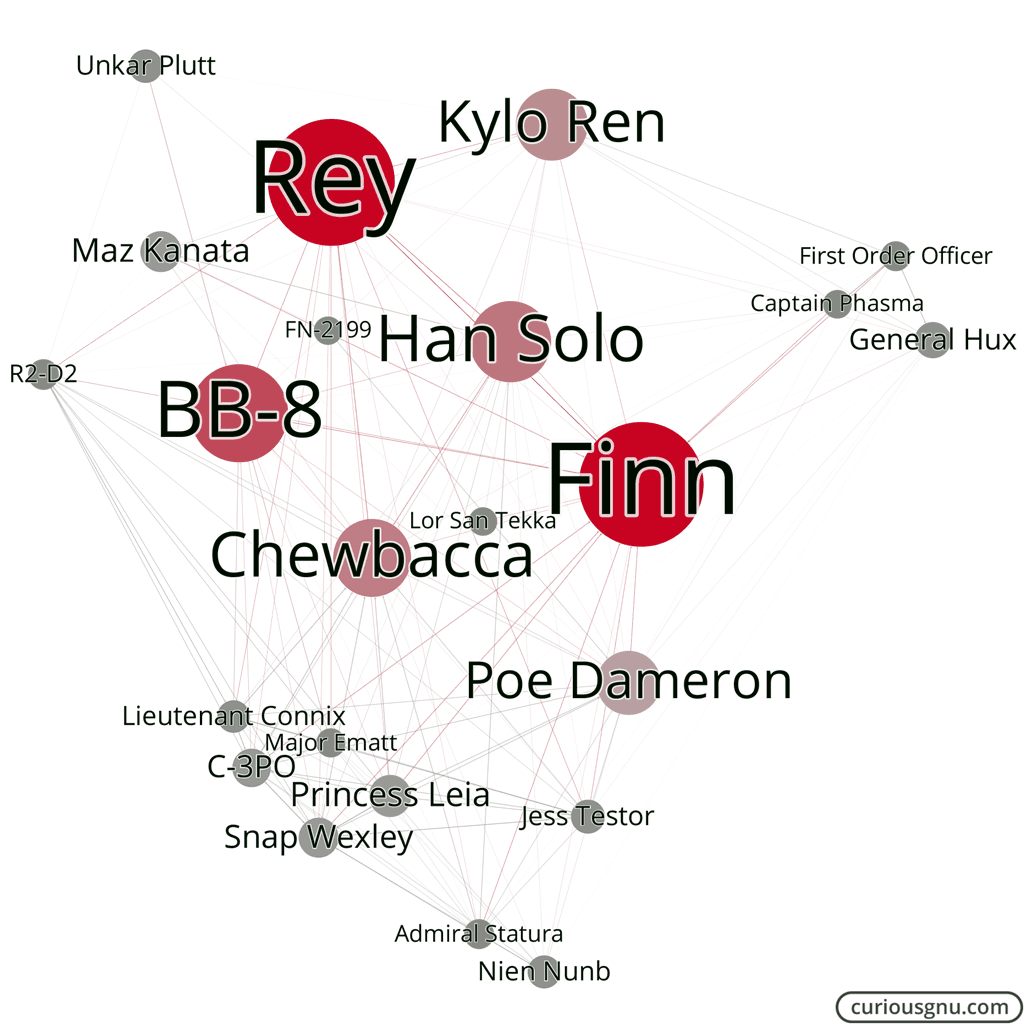
We can use the X-Ray data, not only to identify in which scene a character appears but also with whom else. To visualize this information, I used Gephi, an open source tool to plot networks. My assumption is that the longer characters appear on-screen together, the closer their relationship is. The circle size is based on their total screen time.
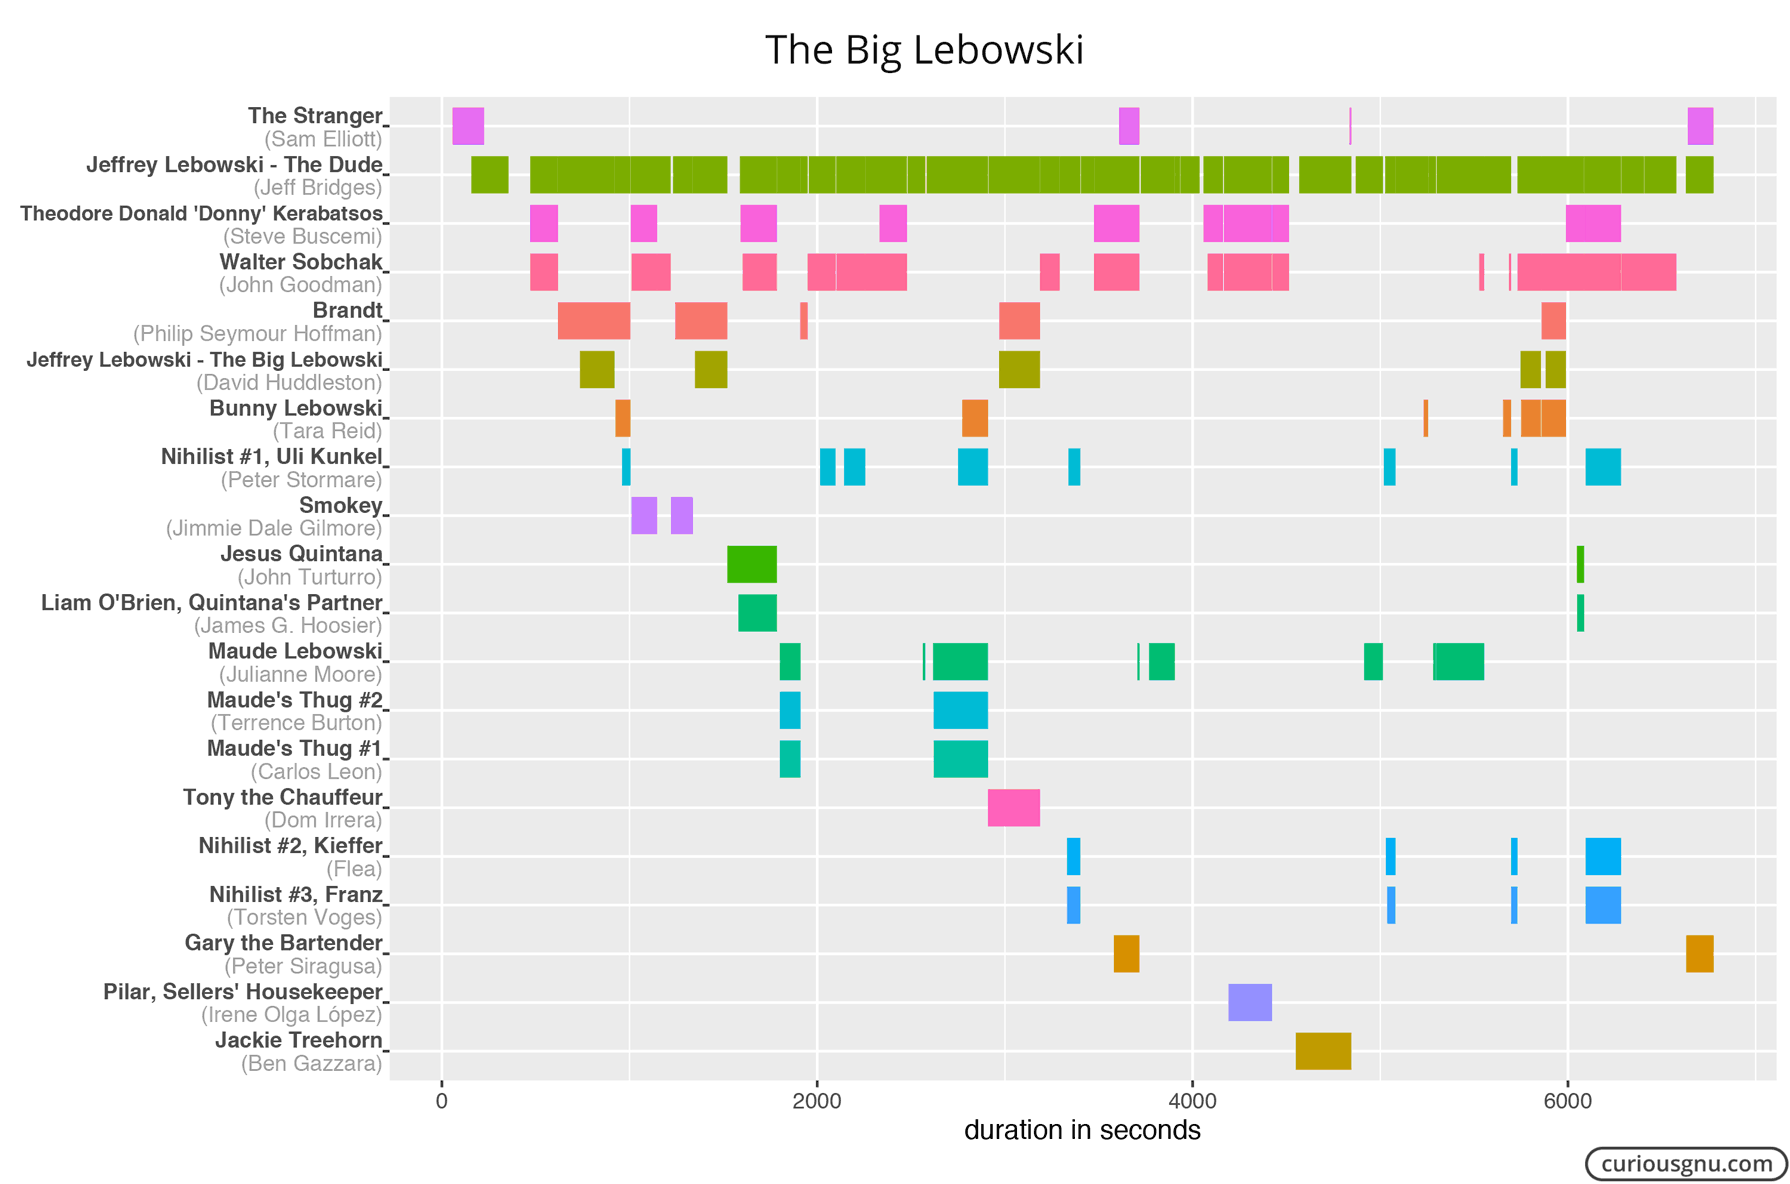
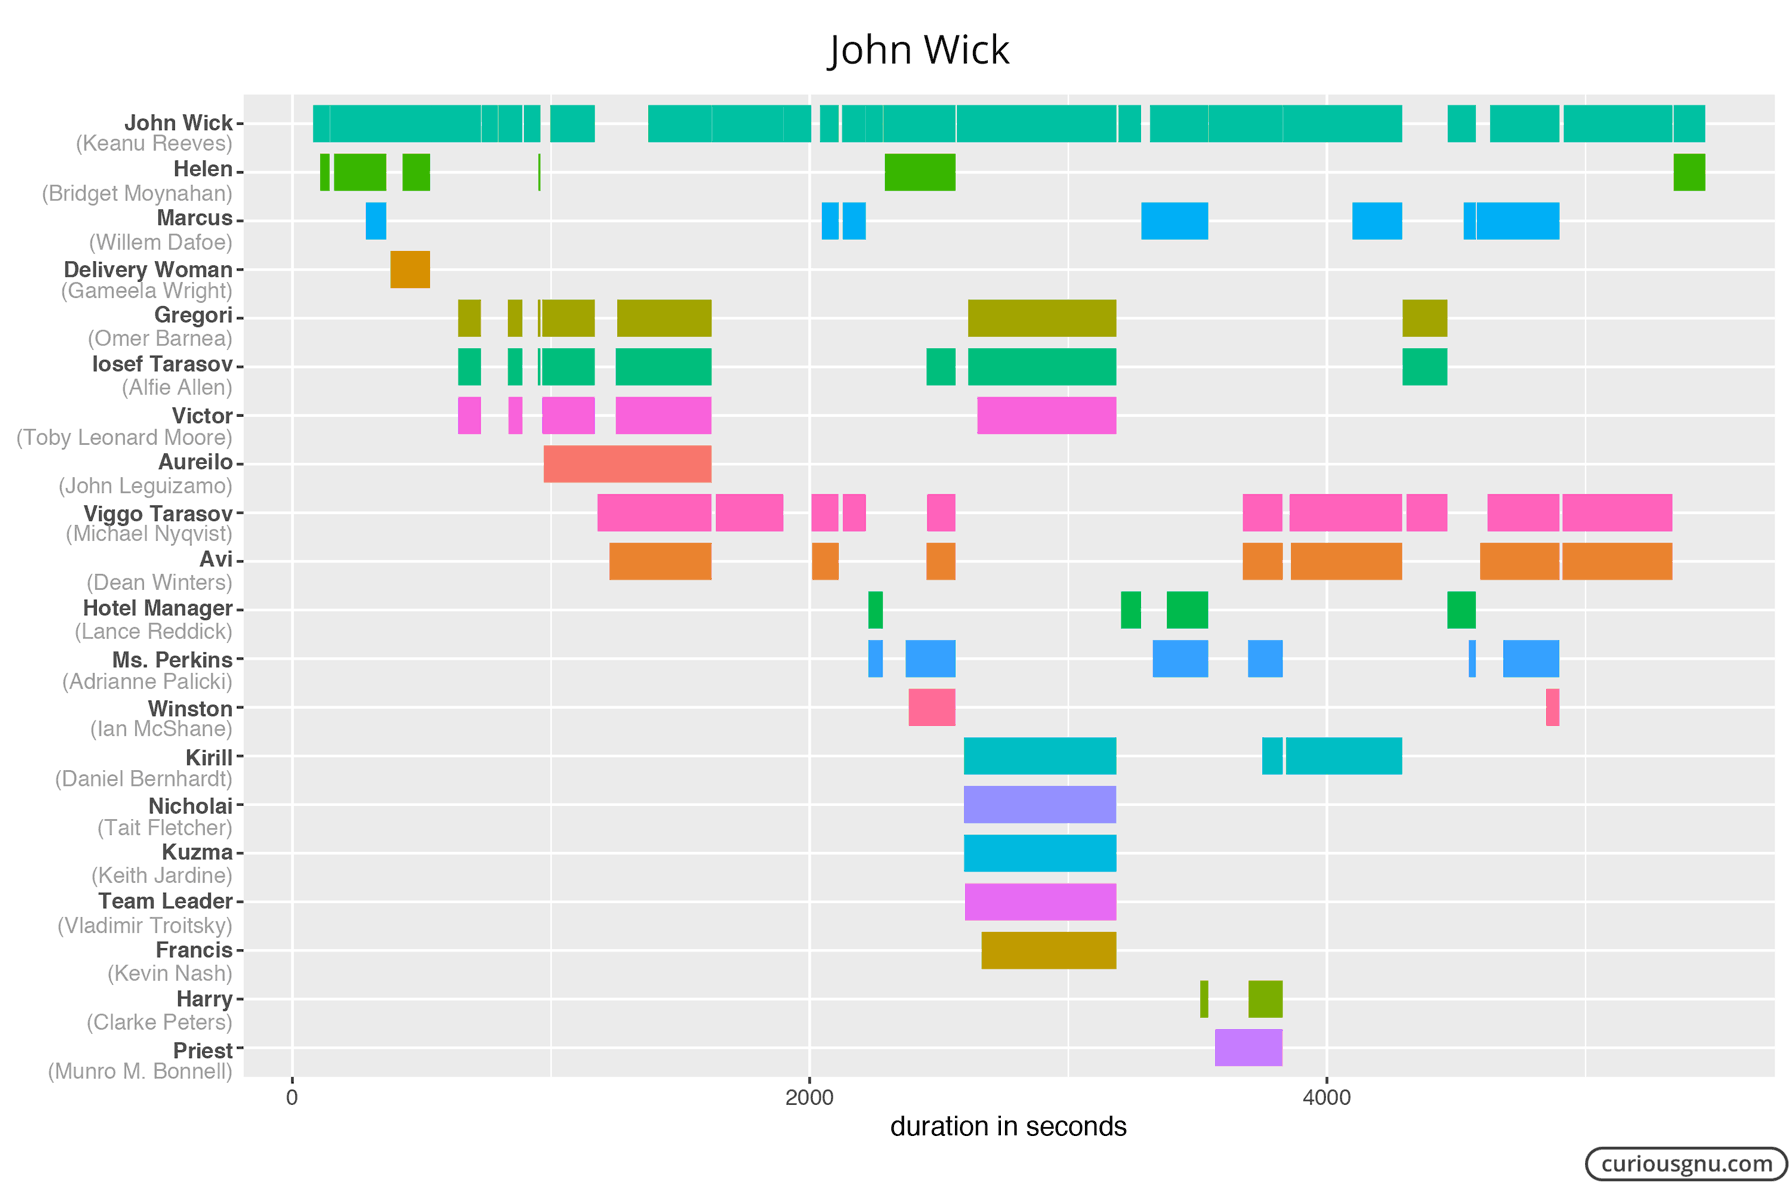
I hope these examples show what you can do with Amazon X-Ray data relatively quickly. The best thing of this approach is that it only requires a minimum manual work. So, here are Gantt charts for three other movies I enjoy:
How to Get X-Ray Data?
The X-Ray feature is based on an unencrypted JSON file that can be downloaded with the Chrome browser. Unfortunately, those files are not publicly available, meaning that you have to start streaming the movie before you can download the file. This also means that you are limited to the content included in your Prime subscription, or you need to rent/buy the movies in which you are interested. Nevertheless, I think it is still an interesting source, especially when you consider the alternatives. Update: On 8 May 2017, I updated this part of the blog post.
- Start Developer Tools: Menu > Tools > Developer Tools
- Open the movie’s product page
- Select the following Developer Tools settings:
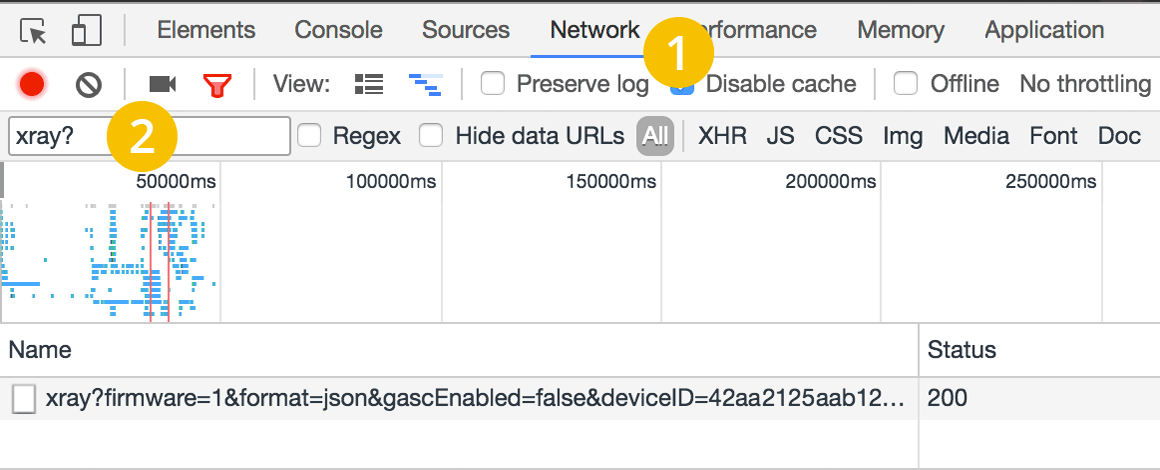
- Click on the gray record button to capture the network traffic
- Reload the product page
- The following file should appear: xray?firmware…
- Right-click on the file > Copy > Copy Link Address
- Download the file to your computer
Now you can use the following Python code to generate a convenient CSV file from the downloaded .json file (e.g., xray.json).
import json
import re
import csv

with open('xray.json') as data:
    data = json.load(data)

scenes = data['page']['sections']['left']['widgets']['widgetList']
scenes = scenes[0]['widgets']['widgetList'][1]['partitionedChangeList']

with open('xray.csv', 'wb') as out:
    w = csv.writer(out)
    w.writerow(['nconst', 'character', 'start', 'end'])
    for s in scenes:
        start = s['timeRange']['startTime']
        end = s['timeRange']['endTime']
        for init in s['initialItemIds']:
            rd = re.search('/name/(nm.+)/(.+)', init)
            if rd is not None:
                w.writerow([rd.group(1), rd.group(2), start, end])
        for item in s['changesCollection']:
            rd = re.search('/name/(nm.+)/(.+)', item['itemId'])
            if rd is not None:
                iStart = item['timePosition']
                w.writerow([rd.group(1), rd.group(2), iStart, end])