In one of my previous blog articles, I wrote about how drug dealers use the darknet to sell their products. For this post, I will use police reports to show you more about drug possession in the real world. I chose the city of Chicago because they make all reported incidents of crime available through their open data platform which is the basis for the following analysis.
What are the most common drugs?
First, I took all reported incidents of drug possession since 2001 and checked how the numbers have changed over the past 15 years. The following graph shows the number of reported incidents by year and substance. The number of incidents of cannabis possessions peaked at more than 23k in 2010 and then decreased by nearly 55%, landing at 11k in 2015. Reported incidents related to the possession of crack cocaine continuously declined over the years, making heroin the second most common drug since 2010. It should be noted that these numbers only refer to the reported incidents of drug possession and not the actual drug consumption.
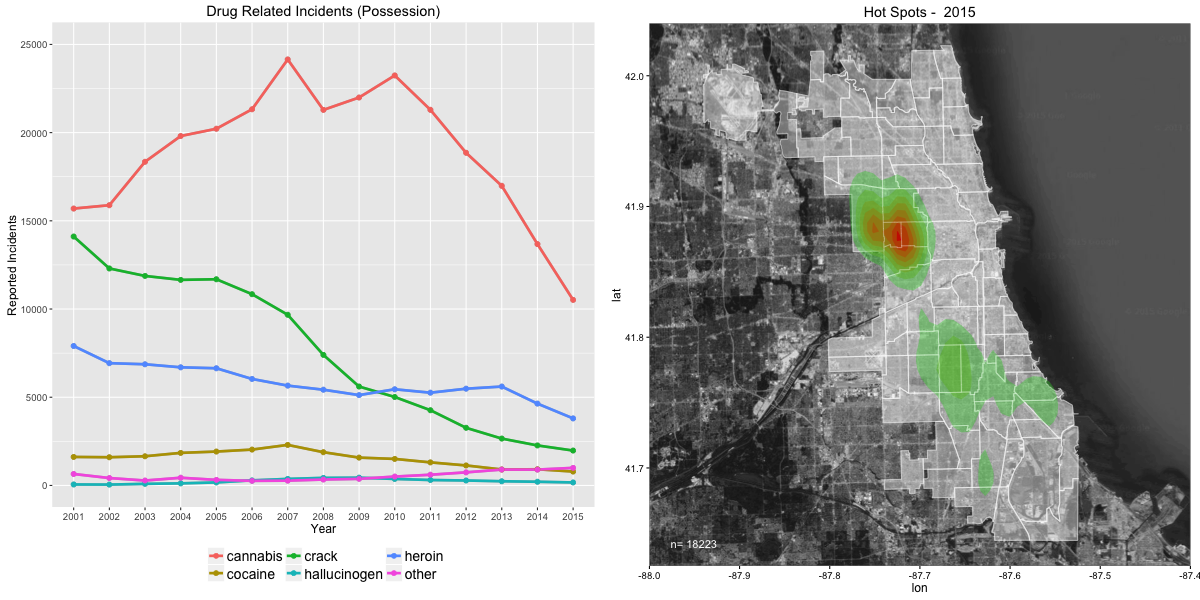
The map on the right shows hot spots in Chicago where many of the incidents took place. This heat map is based on the density of the incidents. In the recent years, we can see a higher concentration of the reports on the West Side.
Do drug preferences differ between areas?
Next, I wanted to find out if some drugs are more popular in certain areas than the others. To do this, I created three new heat maps for the possession of cocaine, heroin, and cannabis. As we can see below, there seems to be a difference between the three substances:
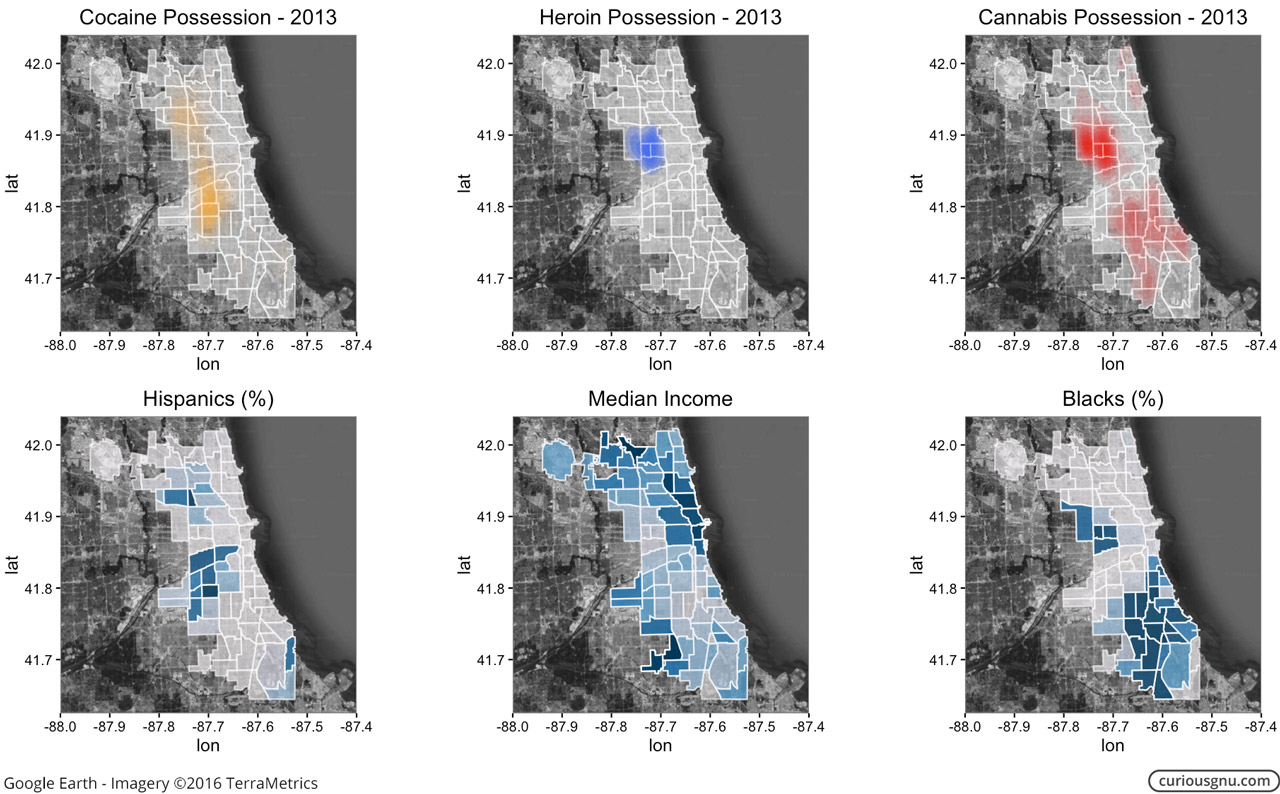
To find an explanation for the local differences, I downloaded census data on a community area level. We can use this data to explore how the community areas differ from each other in factors like education, income, race, or unemployment. If we plot this data in a map format and compare them to the previous heat maps, it shows that there could be a connection between them and the possession of certain drugs.
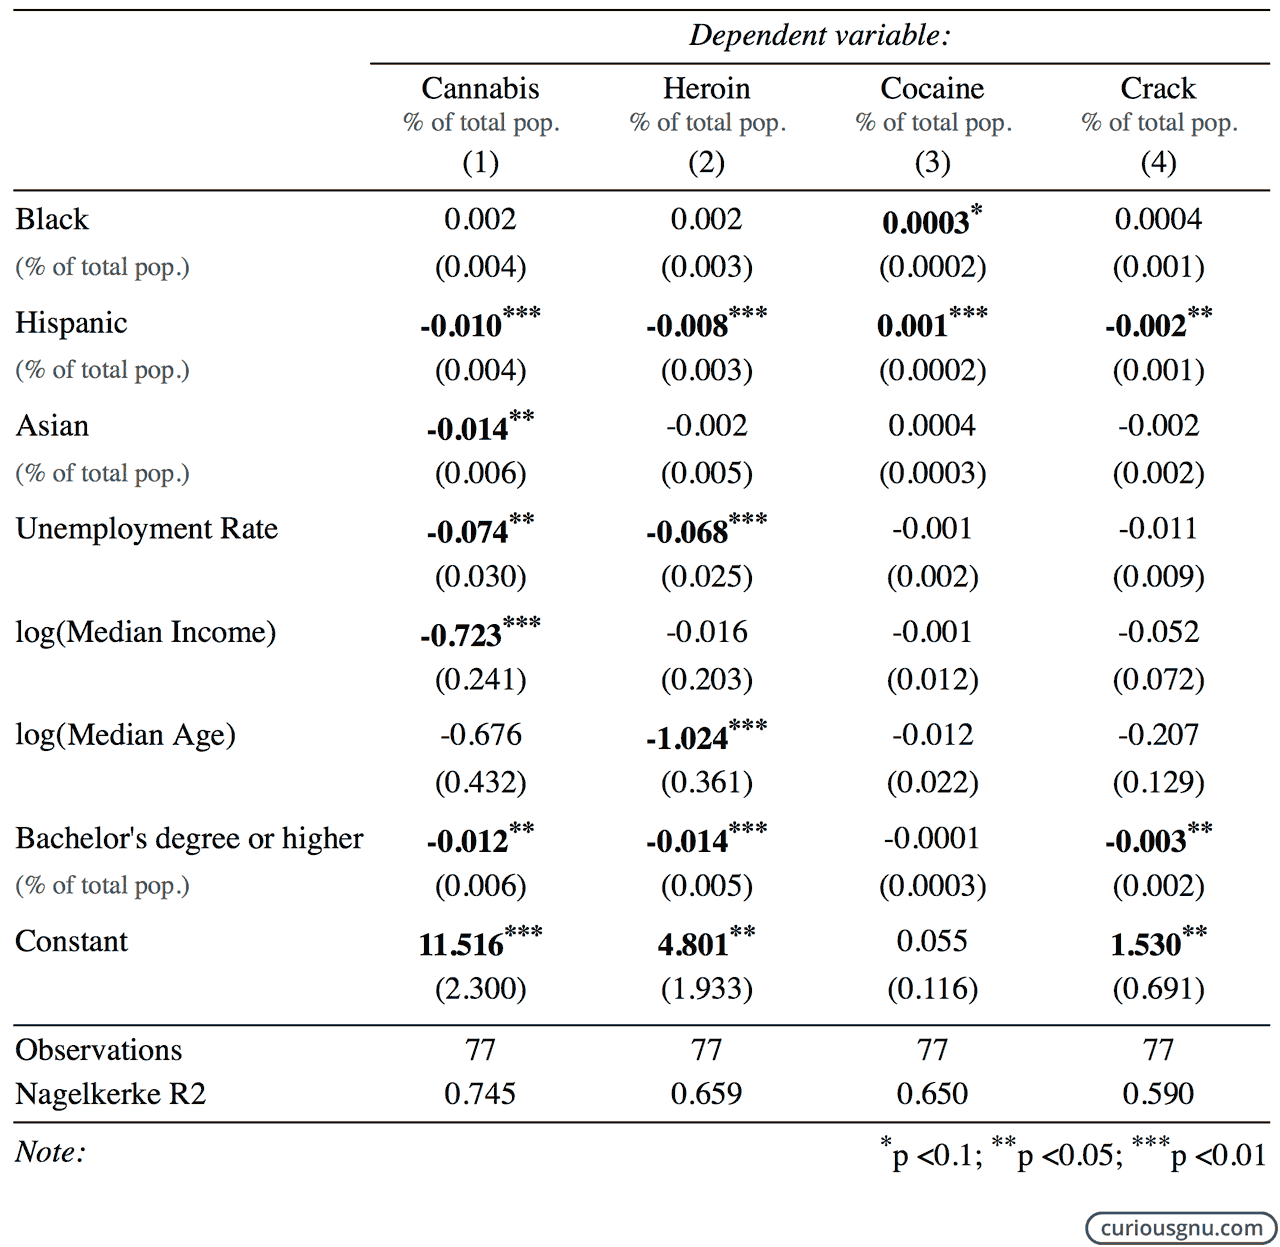
Judging by the looks of graphs is of course, not an appropriate method, which is why I also used a spatial regression to test how education, income, race, and unemployment relates to the reported possession of cocaine, heroin, and cannabis. The depended variables are the percentage of reported incidents based on the total population of the community area in which they occurred.
The results below show that reported cannabis possession is lower in community areas with a higher median income and education. For heroin, we see similar results with the exception that median income is not a significant factor but median age is. For cocaine, the only two significant variables are the relative shares of the Black and Hispanic population. Apparently more incidents of cocaine possession happen in areas with bigger Black and Hispanic populations.
If you have any suggestion or tips for future articles, please feel free to contact me by email or Reddit message.