According to Alexa.com, an Amazon subsidiary that analysis web traffic, YouTube is the world’s most popular social media site. Its user numbers even exceed those of web giants such as Facebook or Wikipedia. Over the past twelve years, YouTube has become a diverse platform where users can find and watch videos in a wide variety of genres, from cute cats to recorded university lectures.
Even though user comments are an integral part of the YouTube community, the comment section is also infamous as a home for trolls, negativity, and insults. For me, the broad acceptance of YouTube makes its user comments an interesting subject that’s worth a closer look. My plan for this post is to use text analysis to find out more about YouTube comments and determine whether they differ among certain categories.
Dataset
To download a large set of YouTube comments, I used a Python script that uses the official YouTube API, which (fortunately) offers generous API limits, allowing us to gather hundreds of thousands of individual comments. For this analysis, I decided to download only comments that refer to one of twenty selected channels in one of the following four categories: comedy, science, TV, and news & politics (see table below). I used Socialblade’s YouTube top list as a guideline. However, I also took the liberty of excluding some channels that didn’t fit the category or targeted non-English-speaking viewers.
| Category | Channels |
|---|---|
| comedy | PewDiePie, SMOSH, CollegeHumor, FailArmy, JennaMarbles |
| science | AsapSCIENCE, SciShow, Numberphile, ScienceChannel, Veritasium |
| TV | Jimmy Fallon, Conan, James Corden, Jimmy Kimmel, TheEllenShow |
| news & politics | TYT, ABCNews, CNN, Infowars, Vox |
Of these channels, the 25 most-watched videos between the years 2015 and 2016 were identified. For each of these videos, up to 500 of the most relevant comments were downloaded. Users responding to other users were ignored to ensure that each comment was an independent contribution. After letting the Python script run for about 1 hour, I ended up with a dataset containing just over 350,000 comments. You can find the script and the R script for the following analysis here: yt_comments_code.zip.
Analysis
For the analysis, I switched from Python to R so that I could use the quanteda package, a handy toolset for quantitative text analysis. First, I generated a comparison word cloud for the four previously defined categories. In contrast to a traditional world cloud, in which the font sizes represent the words’ numbers of occurrences, a comparison word cloud illustrates which words are primarily used in specific categories. Therefore, the text size is linked to a word’s maximum deviation from its rate of occurrence in a category and the average across all comments.
The comparison word cloud shows that while viewers of news videos commented on political and social issues (e.g., trump, racist), comments on videos in the TV category contained more positive words (e.g., love, funny, lol). Furthermore, presumably topic-related keywords characterized comments from the science channels, while the use of profanity appears to be more prevalent in the comment sections of comedy videos.
These findings lead to the question: do viewers’ contributions significantly differ across the four categories regarding complexity and the use of profanity? A readability measurement like SMOG could be used to measure the complexity of a text. Even though such formulas are sometimes used on text snippets like tweets (e.g., Times), I’m not convinced that it is an appropriate approach because brief internet comments and tweets differ substantially from the newspaper articles and business writing for which most of these measurements were originally designed.
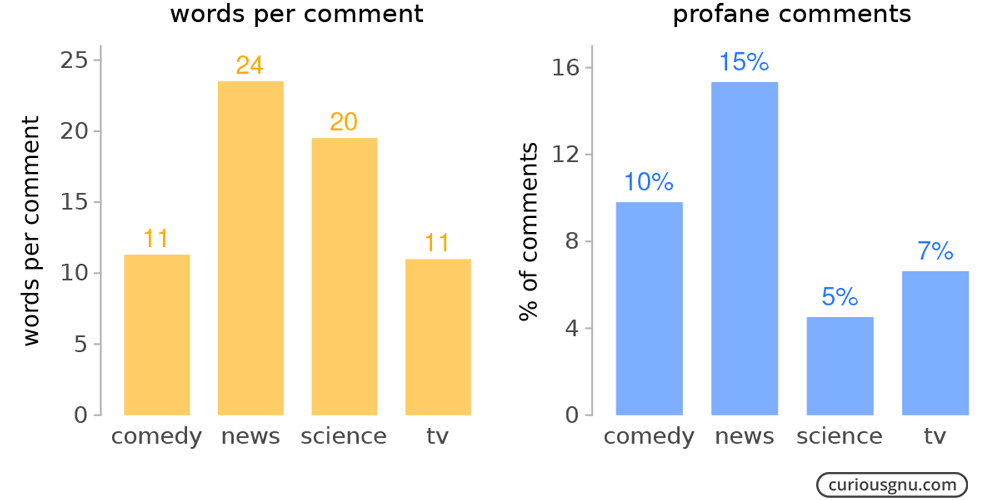
Therefore, I chose a much simpler approach by using the word count of a comment as an indicator for the comment’s complexity. While this indicator cannot, of course, account for the actual context of a comment, it can be a rough estimate of how much effort a viewer put into commenting on a video. Regarding the use of profanity, a comment was classified as profane if it contained at least one profane word. The source of the used swear-word list is noswearing.com. The following bar chart shows the average word length for the four categories and the share of profane comments.
We can see that the average comments on videos in the science and news channels are 20 and 24 words respectively, or about twice as long as the comments on videos in the TV and comedy category. With 15% of profane comments, the news channels have the highest share of profanity, whereas the science channels have the lowest rate, at just 5%. Furthermore, a Kruskal-Wallis test and chi-squared test (+post hoc tests) confirmed that the found differences are statistically significant.
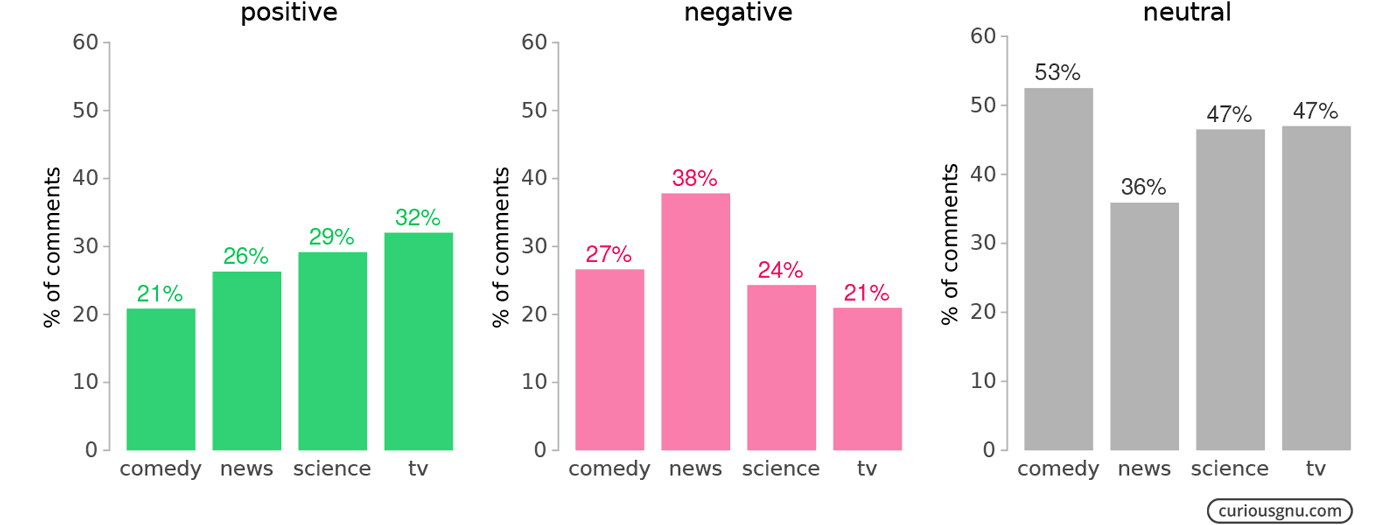
Next, a sentiment analysis was used to determine the polarity of the comments, thereby classifying whether they are positive, negative, or neutral. For this analysis, I employed the Syuzhet R-package, which uses a straightforward knowledge-based technique based on lexicons, which are collections of positive and negative words. In the settings, I chose the bing lexicon by Minqing Hu and Bing Liu. The next bar chart shows what many percentage of the comments in each category are classified as positive, negative, or neutral.
The news category, at 38%, has not only the highest share of negative comments, but also the lowest percentage (36%) of neutral comments. Considering that political issues are often polarizing topics, this result seems to be reasonable. Interestingly, the TV category, with 32% and 21%, has the highest share of positive and the lowest share of negative comments respectively.
Summary
Overall, the analysis of over 350,000 comments shows that their style and content differs substantially across certain YouTube categories. While the average comments on videos about news and politics are longer than comments on other types of content, they also contain significantly more profanity and negativity. Compared to this category, science channels attract comments that are roughly as long, but contain much less profanity. Surprisingly, the comments in the TV category are largely family-friendly and positive. One explanation might be that these channels moderate the comments more strictly than the average news or comedy YouTubers.
If you have any questions or concerns about this post, feel free to write me an email.


